Statistical inference on Histogram#
In this tutorial, we will generate a mock histogram and see if our signal model is good enough to explain the experimental data.
Show code cell content
import numpy as np
import spey
import matplotlib.pyplot as plt
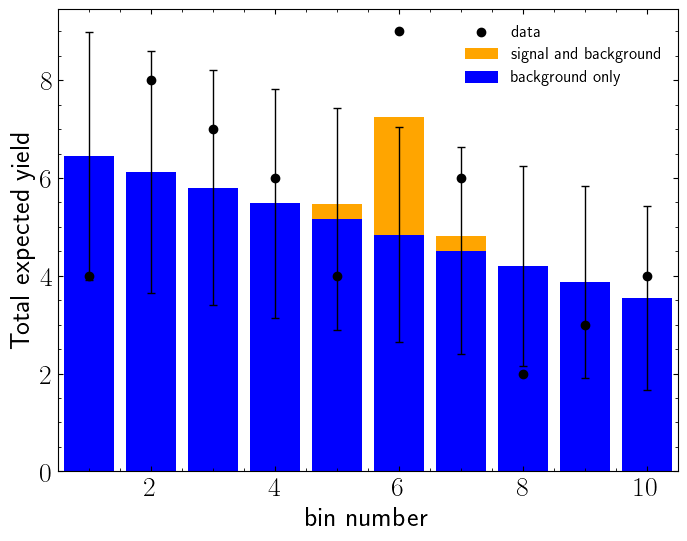
Let us generate a histogram to be used in our example first. In below example, we generate three sets of data, signal (\(n_s\)), background (\(n_b\)) and observarions (\(n\)). The statistical uncertainties on the background yields are shown with black lines.
Show code cell source
fig = plt.figure(figsize=(8, 6))
# Define the binning
nbins = 10
x = np.linspace(1, nbins, nbins)

# The background follows a linear shape
b_yields = np.array([(1 - i / 2 / nbins) for i in range(0, nbins)])
b_fracs = b_yields / np.sum(b_yields)

# The signal shape is a peak
s_fracs = np.zeros(nbins)
s_fracs[4:7] = [0.1, 0.8, 0.1]

# Define the signal and background
s = 3
b = 50
s_and_b = s * s_fracs + b * b_fracs
b_only = b * b_fracs

# Now generate some data for the s+b model
np.random.seed(14)
# Set the random seed to make sure we generate the same data every time
data = np.array(
    [
        np.random.poisson(s * s_frac + b * b_frac)
        for s_frac, b_frac in zip(s_fracs, b_fracs)
    ]
)

# Make a plot of the result
plt.bar(x, s_and_b, color="orange", label="signal and background")
plt.bar(
    x,
    b_only,
    color="b",
    label="background only",
    yerr=np.sqrt(b_only),
    capsize=3,
    error_kw={"lw": 1},
)
plt.scatter(x, data, zorder=10, color="k", label="data")
plt.xlabel("bin number")
plt.ylabel("Total expected yield")
plt.legend(fontsize=12)
plt.xlim([0.5, 10.5])
plt.show()

Lets construct a statistical model. Since the only source of uncertainty is statistical, we can safely assume that non of the bins are correlated in systematic level. Hence we will use "default_pdf.uncorrelated_background" model.
pdf_wrapper = spey.get_backend("default_pdf.uncorrelated_background")
stat_model = pdf_wrapper(
    signal_yields=s_and_b - b_only,
    background_yields=b_only,
    data=data,
    absolute_uncertainties=np.sqrt(b_only),
)
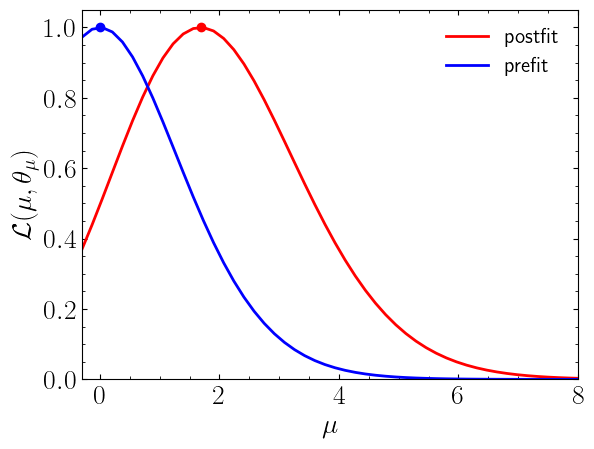
Now we can compute the normalised likelihood distribution for prefit and postfit statistical models.
poi = np.linspace(-0.3, 8, 50)

llhd_postfit = [stat_model.likelihood(p, return_nll=False) for p in poi]
muhat_postfit, max_llhd_postfit = stat_model.maximize_likelihood(return_nll=False)

llhd_prefit = [
    stat_model.likelihood(p, expected=spey.ExpectationType.apriori, return_nll=False)
    for p in poi
]
muhat_prefit, max_llhd_prefit = stat_model.maximize_likelihood(
    expected=spey.ExpectationType.apriori, return_nll=False
)
Show code cell source
plt.plot(poi, llhd_postfit / max_llhd_postfit, color="r", label="postfit")
plt.scatter(muhat_postfit, 1, color="r")

plt.plot(poi, llhd_prefit / max_llhd_prefit, color="b", label="prefit")
plt.scatter(muhat_prefit, 1, color="b")

plt.legend()

plt.ylabel(r"$\mathcal{L}(\mu,\theta_\mu)$")
plt.xlabel(r"$\mu$")
plt.xlim([-0.3, 8])
plt.ylim([0, 1.05])
plt.show()

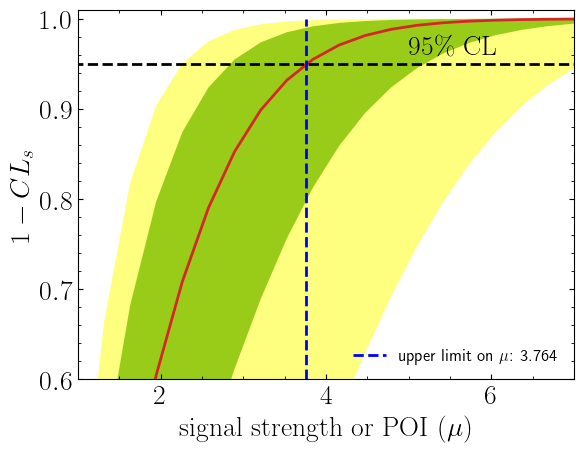
Now let us compute the expected and observed upper limits on signal strength (\(\mu\)) at 95% CL:
print(f"Observed upper limit on µ at 95% CL: {stat_model.poi_upper_limit():.5f}")

expected_pval = stat_model.poi_upper_limit(
    expected=spey.ExpectationType.aposteriori, expected_pvalue="1sigma"
)
muUL_apost = expected_pval[1]
print(
    "Expected upper limit on µ with ± 1σ at 95% CL: "
    + ",".join([f"{x:.3f}" for x in expected_pval])
)
Observed upper limit on µ at 95% CL: 4.66815
Expected upper limit on µ with ± 1σ at 95% CL: 2.834,3.764,5.183
We can use confidence_level flag to change the confidence level of our calculation
print(
    f"Observed upper limit on µ at 68% CL: {stat_model.poi_upper_limit(confidence_level=0.68):.5f}"
)
Observed upper limit on µ at 68% CL: 2.79069
Now let us compute the upper limit by hand:
poi = np.linspace(1, 7, 20)
poiUL = np.array(
    [
        stat_model.exclusion_confidence_level(
            poi_test=p, expected=spey.ExpectationType.aposteriori
        )
        for p in poi
    ]
)
Show code cell source
plt.plot(poi, poiUL[:, 2], color="tab:red")
plt.fill_between(poi, poiUL[:, 1], poiUL[:, 3], alpha=0.8, color="green", lw=0)
plt.fill_between(poi, poiUL[:, 0], poiUL[:, 4], alpha=0.5, color="yellow", lw=0)
plt.plot(
    [muUL_apost, muUL_apost],
    [0, 1],
    ls="dashed",
    color="b",
    label=f"upper limit on $\\mu$: {muUL_apost:.3f}",
)
plt.plot([0, 10], [0.95, 0.95], color="k", ls="dashed")
plt.xlabel(r"${\rm signal\ strength\ or\ POI }\ (\mu)$")
plt.ylabel("$1-CL_s$")
plt.xlim([1, 7])
plt.ylim([0.6, 1.01])
plt.text(5, 0.96, r"$95\%\ {\rm CL}$")
plt.legend(loc="lower right", fontsize=12)
plt.show()

Additionally we can compute the exclusion limit of our signal model to see if our model is excluded.
print(
    f"Observed exclusion confidence level, 1-CLs: {stat_model.exclusion_confidence_level()[0]:.5f}"
)

exp_cls = stat_model.exclusion_confidence_level(expected=spey.ExpectationType.aposteriori)
print(
    f"Expected exclusion confidence level, 1-CLs ± 1σ: {exp_cls[2]:.4f} - {exp_cls[2]-exp_cls[3]:.4f} + {exp_cls[1]-exp_cls[2]:.4f}"
)
Observed exclusion confidence level, 1-CLs: 0.13942
Expected exclusion confidence level, 1-CLs ± 1σ: 0.1620 - 0.0226 + 0.1182
Since our model is not excluded (\(1-{\rm CL}_s < 0.95\)), we may want to see the significance of our signal yields:
print(f"Z = {stat_model.significance()[1]:.3f}")
Z = 1.185
